
Run Time Trial with the
Stryd Power Meter
A run Time Trial is a great way to measure your current state of performance.
With the information provided by the Stryd Run Power Meter it opens up new ways for Coaches and Athletes to perform and then to assess and validate their results from the test.
Watch the video or read the explanation below
(Sorry for the poor video quality)

The Time Trial
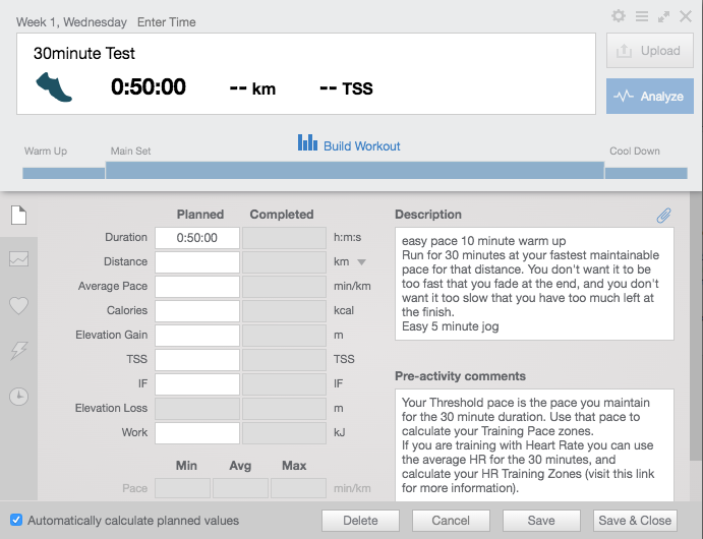
A group of Foot Traffic athletes recently performed an individual run Time Trial (TT) session. This was a 50 minute session which comprised of an easy 10 minute warm-up, a 30 minute interval at your best effort, followed by a 10 minute warm down.
The athletes ran the TT as 15 minutes out followed by 15 minutes back, preferably on a flat course and ideally in low to no wind conditions.
The athletes had a target power to run the first 15 minutes in and then they had the freedom of running as fast as they wanted for the second 15 minutes.
Current Form
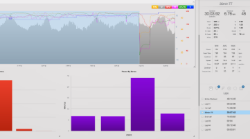
Looking at one of the athletes who performed this TT, we can dive into their Stryd Power Center data.
The day before their TT their best effort for 30 minutes was 212 watts. This was performed about six weeks prior to the TT.
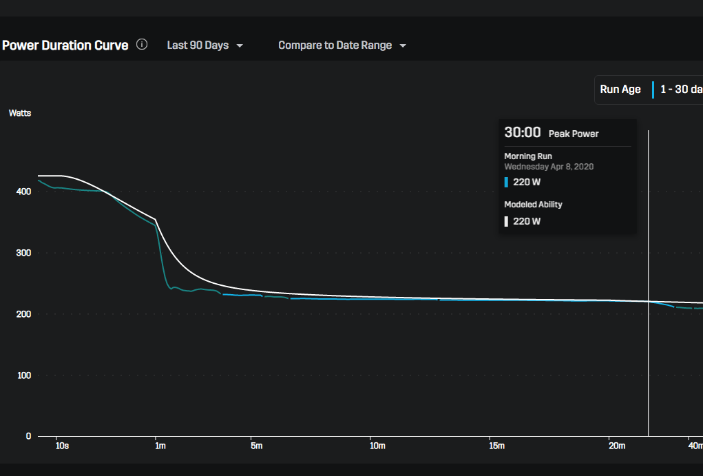
The Stryd Power Center creates a modelled Power Duration Curve, which is the white line in the graph, sitting just above the actual Power Duration Curve.
The modelled curve is based on the information that inputed every time a run is completed and the data is uploaded.
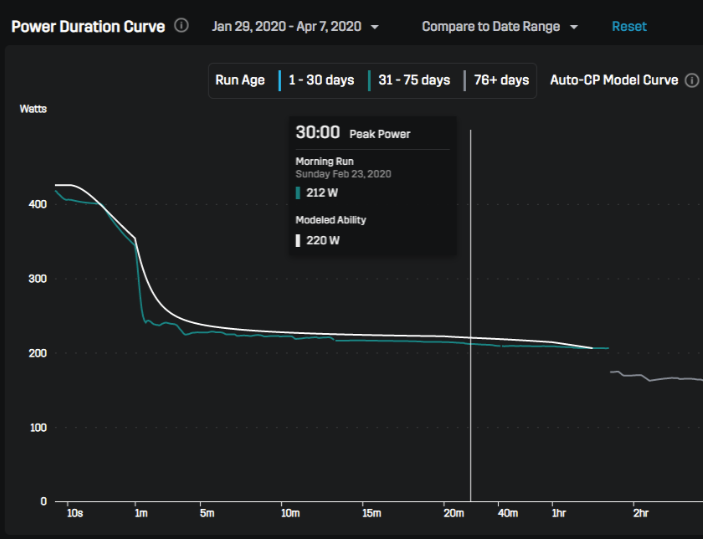
According to the Modelled Curve, this athlete should actually be running 220 watts for their peak 30 minute effort, but they had only run 212 watts to date. The idea of the TT is to take this Modelled number and see how close the athlete actually get to it? I hadn't told the athlete what their modelled ability was, the purpose of the TT was to see what they could achieve.
The only bit of guidance I gave them in terms of pacing was a target of 216w for the first 15 minutes. I selected this amount because it was halfway between their actual Power and Modelled Power Duration Curves. I also knew this value wasn't too high that it would put the athlete off. I wanted this to be a close to 100% effort, but I certainly didn't want it to be a slow death if they had started out too fast.
The Session
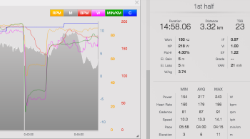
For the first 15 minutes they ran at 218w (4:30/km) just slightly over the target of 216w.
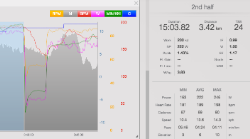
For the second 15 minutes they ran at 222w (4:24/km). A clear negative split
For the 30 minute TT they averaged at 220w (4:27/km).
The Analysis
You will recall that the 30 minute Modelled Power was 220w. This athlete has run exactly to the number the Stryd Software had calculated for them.
You can see in the image to the right, with the filter opened out to the last 90 days, that the 30 Minute Peak Power now lines up perfectly with the Modelled Peak Power at 220w.
From this it's clear that the athlete ran exactly to their best effort for the TT. Consequently they also received an increase in their Critical Power value, so we know the Training Zones that are generated off number are accurate.
Summary
As you can see, with the Stryd Run Power Meter it's possible to make an accurate assumption of your current form, and then perform a TT to validate. It's a great confidence boost to the Athlete and Coach when they can physically and graphically see improvements from all the training.
Interestingly enough, of the 15 Foot Traffic athletes who performed the TT on the same day we saw about an 80% level of accuracy in reaching their Modelled Power during the test. This is a good hit rate, and we will continue to use the 30 minute TT in future as a method of assessment for our athletes.